Brand Managers: Brand Lift Measurement, Platform Rules and 3 Metrics
Brand lift measurement compares people exposed to an ad campaign against a matched, unexposed control group to isolate the causal effect of that advertising on perception and intent. It exists to answer what clicks and impressions cannot: whether the campaign changed how people think about the brand. The output includes absolute lift in percentage points, a significance read, and often a cost per lifted user, all of which tell you whether the creative worked, whether the media plan is worth the spend, and whether upper-funnel investment is paying off.
TL;DR:
- A valid brand lift study requires a demographically matched control group to minimize noise in measuring campaign-caused perception changes.
- Most campaigns should prioritize tracking three key metrics: ad recall, message association, and consideration or intent, depending on budget.
- Absolute lift in percentage points and statistical significance are the most critical results to report for practical, clear insights.
- Lift is most reliable when the study is properly pre-registered, has sufficient response volume, and uses consistent question wording in repeated measurements.
- Brand lift results should be interpreted as diagnostic signals, informing brand health and positioning rather than direct revenue or sales impact.
Table of Contents
- What Brand Lift Measures That Clicks Cannot
- Core Brand Lift Metrics to Track
- Designing a Valid Brand Lift Study
- How Lift Is Calculated and What to Report
- Best Practices and Common Pitfalls
- Interpreting Results and Setting Benchmarks
- When a Brand Lift Study Is Worth Running
- Turning Lift Data Into Strategic Decisions
- Where to Verify Platform Rules and Formulas
- Sources
What Brand Lift Measures That Clicks Cannot
Brand lift works because it borrows the logic of a controlled experiment. One group sees the ad; a matched group does not. Both groups then answer the same survey questions about awareness, recall, or purchase intent. The difference between their answers, not the raw score of either group, is the lift. That comparison is what separates brand lift from a simple before-and-after check on brand tracking, which can be thrown off by seasonality, news events, or a competitor’s launch that has nothing to do with your campaign.
This is a fundamentally different exercise than last-click attribution. A click tells you someone was ready to act right now. A lift study tells you whether someone’s opinion moved, even if they never click anything. Amazon’s version of this, run through its DSP and sponsored ads ecosystem, layers in audience segment breakouts so you can see which audiences moved and which didn’t, a level of detail a pure conversion report will never give you.
A few structural pieces make or break the read:
- Baseline measurement. A pre-flight survey captures unaided awareness before the campaign runs, so you know how much headroom exists.
- Platform-native baselines. Google, Meta, and Amazon can auto-generate a holdout group for eligible campaigns, saving setup time but offering less visibility into how that group was built.
- Matched control. Whether native or third-party, the control group needs to mirror the exposed group demographically and behaviorally, or the “lift” you see is partly noise.
Core Brand Lift Metrics to Track
Most brand lift studies pull from the same handful of metrics, and each one answers a different stakeholder question. Picking the wrong one for your campaign goal is the single most common reason a study gets dismissed as “inconclusive” when it actually worked.
Ad recall asks respondents whether they remember seeing an ad from your brand recently, often phrased as “Do you recall seeing an advertisement from [Brand] in the past two days?” This is the fastest metric to move and the easiest to detect, which makes it the default choice for short flights or limited budgets.
Aided and unaided awareness measure whether people know your brand exists at all, either by prompting them with a list of brands or asking them to name brands in a category unprompted. Unaided awareness is the harder bar to clear and the more valuable signal, since it means your brand occupies real mental real estate, not just recognition when prompted.
Message association checks whether people connect a specific idea, tagline, or benefit to your brand. SurveyMonkey’s guidance frames this as something like “Which of these brands do you associate with [specific attribute]?” It’s the metric that tells you whether your creative is actually landing the message you paid to deliver, as opposed to just getting attention.
Favorability asks respondents to rate their overall opinion of the brand, usually on a scale. It moves more slowly than recall and requires a cleaner sample to detect reliably.
Consideration measures whether people would include your brand in a shortlist for their next purchase in the category. This sits closer to the bottom of the funnel and tends to need a larger, more qualified audience to show movement.
Purchase intent is the highest bar: whether someone says they intend to buy from you in a defined window. It’s the metric executives care about most and the one that moves least, since intent is downstream of awareness, favorability, and consideration all working together.
For most campaigns, three primary metrics is the practical ceiling:
- Pick one fast-moving metric (recall or awareness) to confirm the campaign registered at all.
- Pick one message-level metric (association or favorability) to judge creative quality.
- Pick one funnel metric (consideration or intent) only if your budget and reach can realistically support detecting it.
Trying to track all six on a mid-size budget usually means none of them reach statistical significance.
Designing a Valid Brand Lift Study
A lift study is only as trustworthy as its control group. The two paths here are a randomized holdout, where the platform withholds ads from a portion of the eligible audience at random, and a matched control, where a third-party panel selects people who resemble your exposed audience but never saw the campaign. Randomized holdouts are cleaner in theory but risk contamination if someone in the control group sees your ad on another platform or device. Matched panels avoid that but introduce sampling bias if the match isn’t tight.
Platform rules shape what’s even possible. Google Ads Brand Lift requires minimum budget and response thresholds before it will run a study, and offers a Standard or Enhanced Lift option, with Enhanced Lift costing more but pulling in a larger response pool for more granular reads. Amazon’s version similarly gates eligibility on minimum spend and impression volume, though it can return results in as few as ten business days.
Here’s a practical sequence for setting one up:
- Confirm eligibility first. Check the platform’s minimum budget and audience size requirements before you commit creative and media dollars to the flight.
- Run a pre-flight baseline where possible. A short survey before launch captures unaided awareness and headroom, isolating campaign-driven change from organic drift.
- Cap your metrics. Most platform surveys limit how many questions you can field per respondent; two to three metrics keeps completion rates high.
- Let the flight run long enough to reach the response minimum. Cutting a study short is the most common cause of a “not enough data” status.
- Wait a short buffer period after flight end before closing the post-flight survey, so late-arriving exposures register and don’t get lost.
- Re-measure on future flights using the same question wording, so results are comparable over time instead of one-off snapshots.
Pro Tip: If you get a “not enough data” result, don’t just rerun the same setup. Google’s Display & Video 360 documentation recommends consolidating narrow audience segments or extending the flight window before troubleshooting anything else.
How Lift Is Calculated and What to Report
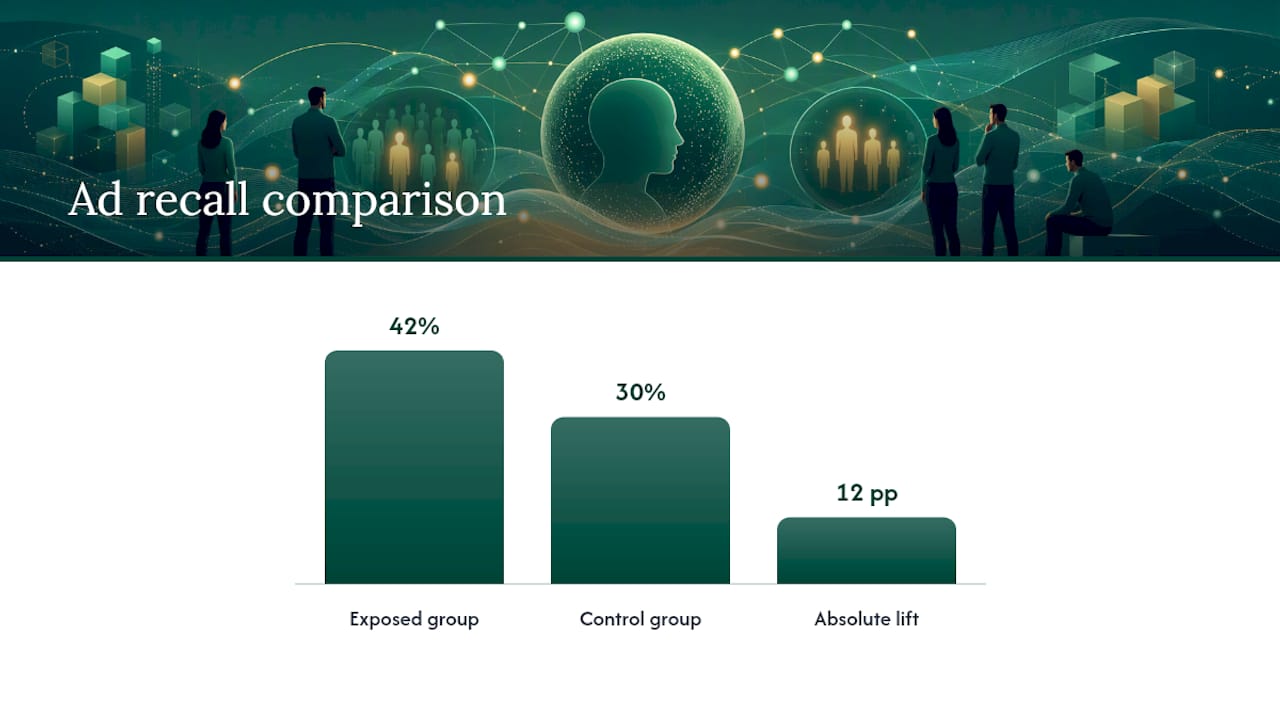
Absolute lift is the number that matters most to stakeholders: it’s the difference in positive response rates between exposed and control groups, expressed in percentage points. If 42% of the exposed group recalls your ad versus 30% of the control group, absolute lift is 12 points. MetricGate’s methodology treats this as the primary reporting figure precisely because it’s easy to explain and hard to misread.
Relative lift divides that same gap by the control group’s baseline, which is useful when comparing across campaigns with very different starting points. A 12-point absolute lift off a 5% baseline is a much bigger relative jump than the same 12 points off a 40% baseline.
Statistical significance is where most reports fall short. A two-proportion z-test or chi-square test tells you whether the gap between exposed and control is likely real rather than random noise, and effect size, measured with Cohen’s h, tells you whether that gap is large enough to matter practically even when it’s statistically significant.
| Statistic | What it tells you | When it matters most |
|---|---|---|
| Absolute lift | Raw percentage-point gap | Primary number for any stakeholder report |
| Relative lift | Gap normalized against baseline | Comparing campaigns with different starting awareness |
| Two-proportion z-test / chi-square | Whether the gap is statistically real | Before claiming any result is a “win” |
| Cohen’s h | Whether the gap is practically meaningful | Planning sample size and setting expectations upfront |
Statistic to watch: a result flagged as “not enough data” almost always traces back to underpowered sample size, not a failed campaign. Before rerunning the study, check whether the audience segment was too narrow to hit the platform’s response threshold.
Best Practices and Common Pitfalls
Most brand lift studies fail for design reasons, not because the advertising didn’t work. The fixes are mostly procedural.
- Pre-register your metrics and hypothesis before launch. Deciding what “success” looks like after you see the data is how false positives sneak into board decks.
- Guard the control group against contamination. If someone in your holdout sees the campaign on another device or platform, the comparison weakens without anyone noticing.
- Don’t slice segments after the fact looking for a win. If the topline result is flat, breaking the data into ten smaller audience cuts until one shows significance is a statistical trap, not a finding.
- Watch for underpowered designs. A narrow targeting strategy paired with a short flight often can’t generate enough responses to detect a real effect, even when one exists.
- Interpret absolute lift against headroom. A brand with 80% unaided awareness has little room to move on that metric; a 3-point gain there can matter more than a 15-point gain for a brand starting at 10%.
- Never claim revenue impact from a lift study alone. Lift measures perception change. Connecting that to revenue requires linking the study to actual behavioral or sales data, not inferring it from favorability scores.
Pro Tip: Nielsen’s approach to this is worth borrowing even outside their platform: benchmark your results against your own prior campaigns and category norms, not against an arbitrary “good lift” number someone read in a case study. Nielsen’s Brand Lift methodology treats historical comparability as the real signal.
Interpreting Results and Setting Benchmarks
There’s no universal number that separates a “good” lift from a bad one. A 4-point gain on a purchase intent metric, which is notoriously hard to move, can matter more than a 20-point gain on ad recall, which moves easily for almost any campaign with decent reach. Report absolute lift alongside its confidence interval, the count of lifted users, and cost per lifted user, since that last figure is what lets a media team compare this campaign’s efficiency against the next one.
Context matters more than the raw figure:
- A high-awareness brand should expect smaller lift on awareness metrics and look instead at favorability or association for movement.
- A launch campaign starting from near-zero awareness should expect and demand larger absolute swings before calling the flight a success.
- Segment-level results tell you where to act: a lift concentrated in one age group or region suggests a targeting fix, while a flat lift across every segment suggests the creative itself isn’t landing.
Statistic to watch: treating one study as the final word is a mistake most teams make once and don’t repeat. Nielsen’s benchmarking approach points out that lift compounds across campaigns; running the same study design on sequential flights shows whether brand equity is actually accumulating or just spiking and fading with each burst of spend.
When a Brand Lift Study Is Worth Running
Not every campaign justifies the cost and setup time of a formal lift study. It earns its place in specific scenarios.
- New creative concepts. Before scaling a new campaign idea across channels, a lift study tells you whether the message is actually landing before you commit the full budget.
- Product or brand launches. Launches need to prove awareness and consideration are moving, since there’s no existing sales history to fall back on.
- Major sponsorships or cross-channel brand plays. These carry big budgets and diffuse, hard-to-track outcomes, which is exactly where a controlled comparison earns its cost.
- Skip it for small pilots or narrow targeting. If reach is too limited to hit a platform’s response threshold, the study will likely return inconclusive results regardless of how well the campaign performs.
Pair brand lift with other measurement layers rather than treating it as a standalone verdict. Behavioral tracking and incrementality testing tell you what people did; brand lift tells you what they now think. Used together, they show whether a shift in perception is actually translating into the funnel movement your sales team is waiting on.
Turning Lift Data Into Strategic Decisions
Most teams stop at the dashboard. A lift report that shows message association barely moved while ad recall spiked hard isn’t a creative problem, it’s usually a positioning problem, and no amount of new copy fixes a positioning gap. That distinction is the difference between a Brand-Backed Performance™ read on the data and a media optimization read on the same numbers.
When favorability lags while awareness climbs, the instinct is almost always to blame the creative team. Often the real issue sits upstream: the brand is getting seen, but what it stands for isn’t clear enough to move opinion. That’s an executive tradeoff question, not a media buy question, and it belongs in the same conversation as product and sales alignment, not buried in a quarterly ad report. Readers working through that kind of gap can find more on how positioning drift shows up operationally in Quincy Samycia’s frameworks.
Treat every lift study as a diagnostic on brand health, not a report card on one campaign. A single flight tells you whether the ad worked. A series of them, read together, tells you whether the brand itself is gaining ground, and that’s the number that should be driving budget conversations at the executive table.
— Quincy
Where to Verify Platform Rules and Formulas
Platform rules change, so check them directly rather than relying on secondhand summaries. Google Ads’ Brand Lift documentation covers eligibility and metric options, while Display & Video 360’s help center explains response thresholds and troubleshooting. MetricGate’s calculator docs walk through the statistical formulas, Nielsen’s methodology page covers benchmarking, and SurveyMonkey’s guide offers sample question wording for teams building their own survey instrument.
If your lift data keeps surfacing the same gap between attention and conviction, that’s rarely something a media plan alone can fix. Quincy Samycia works with brand and executive teams to trace that gap back to positioning and translate it into decisions product, marketing, and sales can act on together. Explore the frameworks behind that process or get in touch directly to talk through what your results are actually telling you.
Sources
- Brand Lift (Google Ads) - Help Center
- Brand Lift Measurement Calculator | MetricGate
- Nielsen Brand Lift - Nielsen
- How to measure brand lift and measure the impact of your advertising - SurveyMonkey