Half Day Customer Experience Mapping to Create Named Owners
Customer experience mapping is the practice of visualizing a persona’s actions, touchpoints, thoughts and emotions across a specific scenario so a team can see where friction happens and who should fix it. The outcome worth aiming for is narrowly defined: a short, prioritized list of opportunities with named owners. Done right, it reduces friction at the points that cost retention and conversion, not just a pretty diagram nobody opens again.
TL;DR:
- Customer experience maps should focus narrowly on one persona and scenario for faster, more actionable insights.
- Including clear ownership, specific opportunities, and measurable outcomes is essential to ensure the map drives meaningful improvements.
- Gather evidence from targeted interviews and support logs quickly, then synthesize a simple narrative before creating a detailed map.
- Use tools that align with your collaboration style, such as whiteboards for teams or slides for leadership, and ensure they can export into your systems.
- Regularly review and update maps, ideally quarterly for active scenarios and annually for stable ones, with follow-up meetings scheduled before mapping concludes.
Table of Contents
- What customer experience mapping covers and when to use it
- The components every map needs to be useful
- A step-by-step process you can run this week
- Choosing the right tools and templates for your team
- Turning map insights into measurable results
- Why most maps end up ignored, and how to fix that
- Connecting mapping work to brand strategy and growth
- What facilitating these workshops actually teaches you
- How Quincy Samycia helps turn a map into owned outcomes
- Where to go deeper on frameworks and templates
- Sources
- FAQ
What customer experience mapping covers and when to use it
Customer experience mapping and buyer-journey mapping are often used interchangeably, but they answer different questions. A buyer-journey map focuses on the path to a purchase decision: awareness, consideration, intent. A customer experience map is broader. It can cover the full relationship with a brand, or it can zoom into a single interaction, like a support call or an onboarding flow. IBM describes a customer journey map as a visual representation of every experience a customer has with a brand, spanning actions, thoughts, emotions and pain points, and notes that maps can be narrow or lifecycle-wide depending on the goal. A service blueprint adds a third layer: the backstage systems, staff and processes that produce the frontstage experience the customer sees.
Common lifecycle stages include awareness, consideration, purchase, postpurchase and advocacy, though B2B teams often need more granularity. For complex sales cycles, IBM recommends splitting research, evaluation, procurement, implementation and renewal into their own stages rather than forcing everything into a simple five-stage model.
Before starting, decide your scope deliberately:
- Map one persona and one scenario when you need a fast, actionable fix for a known problem.
- Map the full lifecycle only when leadership needs a strategic view across the entire relationship.
- Default to the narrower scope. It ships faster and gets used more.
The components every map needs to be useful
A map earns its place on a wall (or in a shared doc) only if it captures specific, checkable fields. Skip one of these and the map becomes decoration.
- Actor and scenario: a named persona with an explicit goal, not a vague demographic.
- Journey phases: the stages the persona moves through, with the touchpoints and channels tied to each.
- Actions: what the persona actually does at each step, in plain verbs.
- Thoughts and emotions: a sentiment line that tracks mindset shifts, backed by real evidence rather than guesses.
- Opportunities: the gaps or friction points worth fixing, each written as a specific statement, not a complaint.
- Ownership metadata: who owns the fix, the target metric, and a deadline.
MindTools lays out this same checklist order: define objective and scope, pick a persona, outline stages, inventory touchpoints, add emotions, surface pain points and opportunities, then prioritize and assign owners. The sentiment line matters more than it looks: without it, a map is a flowchart. With it, a map shows where the experience actually breaks down emotionally, which is usually where retention leaks.
Pro Tip: Write every opportunity as “customers struggle to X because Y,” not as “fix the checkout page.” Specificity is what keeps an opportunity actionable months later.
A step-by-step process you can run this week
You don’t need a quarter-long initiative to produce a usable map. Here’s a workflow that fits inside a week if you keep scope tight.
- Set the objective and scope. Pick one persona, one scenario, and define the success metric before anyone opens a whiteboard. If you can’t name the metric, the mapping effort will drift.
- Collect evidence fast. Pull from customer interviews, support logs, analytics and reviews. MindTools notes these same sources, interviews, analytics, surveys and support interactions, as the baseline evidence set for a credible map. A handful of well-chosen interviews beats a large, unfocused survey.
- Run the workshop. Atlassian’s Team Playbook outlines a structured, timeboxed session: define scope, set the stage, build a back story, map thoughts and feelings, chart pain points, draw the sentiment line, analyze, then follow up with a stakeholder summary. Sort sticky notes into frontstage (what the customer sees) and backstage (what makes it happen) zones as you go.
- Synthesize into a minimum viable map. Before polishing anything, Nielsen Norman Group advises writing the customer’s story in plain narrative first. The map should emerge from that story, not replace it. A rough map that captures the real friction beats a polished one that papers over it.
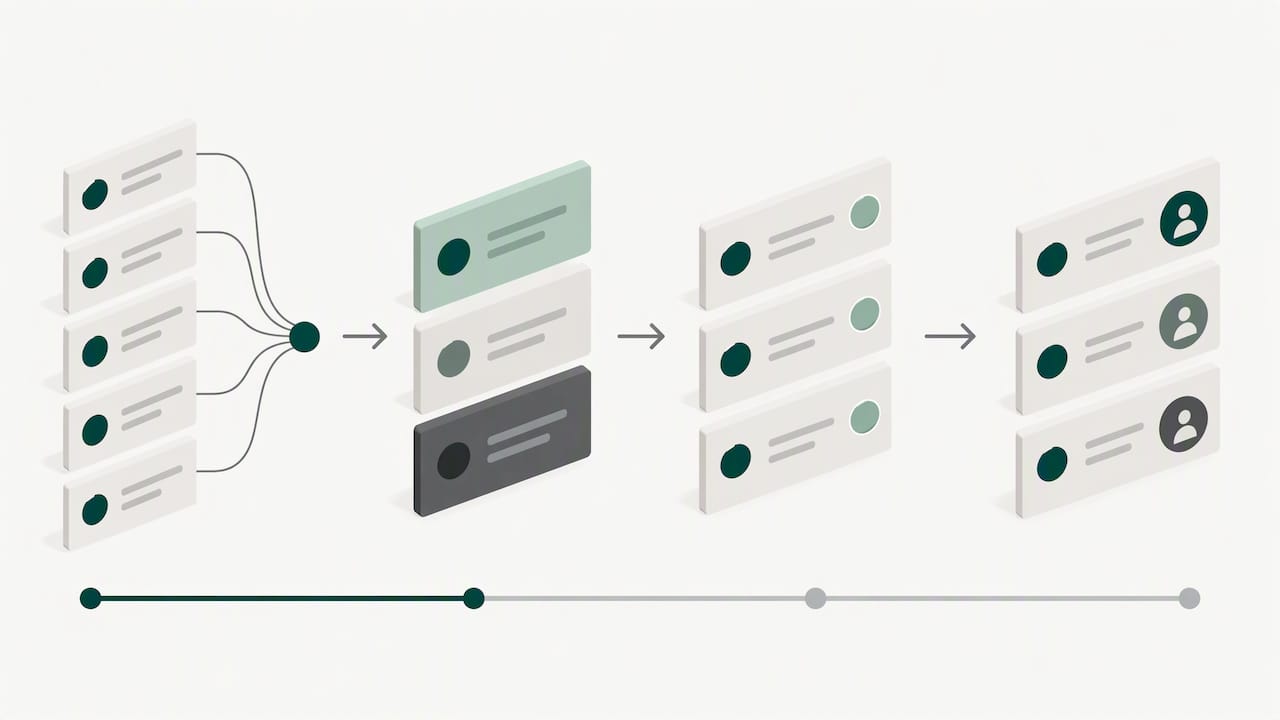
- Prioritize, assign and validate. Score each opportunity by impact versus effort, assign an owner, set an acceptance criterion, and plan a quick validation step, a follow-up interview or an A/B test, before committing resources. Set a refresh cadence so the map doesn’t go stale.
This sequence mirrors the governance-first approach in the Rutgers Business Review’s seven-step framework, which treats mapping touchpoints, measuring their strengths and weaknesses, and quantifying costs and benefits as sequential steps rather than a one-time workshop output.
Pro Tip: Timebox the workshop itself to a half day. Longer sessions produce more sticky notes, not more clarity.
Choosing the right tools and templates for your team
The format you pick should match how your team collaborates and how much traceability you need, not which tool looks the most professional.
- Use a collaborative whiteboard, the Miro or Mural style, when a cross-functional group needs to build the map together in real time.
- Use a slide template when the map’s primary audience is leadership and the deliverable is a summary, not a working document.
- Use a dedicated journey-mapping or service-design tool when you need version control, evidence linking and export into product or issue-tracking systems.
On template shape: a swim-lane map works well for comparing stages across channels, a linear timeline suits a single scenario, and a full service blueprint is worth the extra effort only when backstage operations are part of the problem. Miro’s template library covers most of these formats, though it’s worth rechecking any vendor’s current feature set and plans before committing, since they change. Whatever you choose, confirm it can export into whatever system your product and support teams already use, or the map will live in isolation.
Turning map insights into measurable results
A map that never produces a number isn’t finished. Pair each opportunity with both an outcome metric (conversion, retention, task success) and an effort metric (time on task, contact attempts, support ticket volume). The two together tell you whether a fix actually worked or just felt better.
To prioritize, estimate rough impact and cost for each opportunity, then build a simple business case: expected lift in the outcome metric against the effort required to fix it. Watermark Consulting’s 2026 analysis compared experience leaders and laggards and recommends tracking outcome and effort metrics rather than assuming a direct link to overall firm performance. That’s a useful caution: a better experience score doesn’t automatically prove itself in revenue without its own validation step.
- Validate fixes with follow-up interviews before declaring a win.
- Run A/B tests where traffic allows for a cleaner read on impact.
- Check analytics weekly during the first month after a change ships.
- Refresh the map on a fixed cadence, quarterly for active scenarios, annually for stable ones.
Why most maps end up ignored, and how to fix that
Most abandoned maps share the same root causes: scope too broad to act on, no named owner, too much time spent on visual polish, and no real customer evidence behind the sentiment line.
The fixes are specific. Map one persona and one scenario at a time. Build a minimum viable map before anyone touches color or layout. Assign a named owner and a deadline to every opportunity, with an acceptance criterion that defines “done.” Nielsen Norman Group’s guidance on this point is blunt: a simple, evidence-labeled map that drives decisions outperforms a polished one nobody uses.
- Watch for an executive sponsor who attends the workshop, not just the readout.
- Watch for a cross-functional forum that actually reviews and acts on the opportunity list.
- Treat a map with no scheduled follow-up meeting as a map that will die.
Pro Tip: Ask for calendar invites to the next two review meetings before the workshop ends. If no one will commit, the map won’t survive contact with next quarter.
Connecting mapping work to brand strategy and growth
A map’s opportunities mean more when they tie back to how a brand positions itself and goes to market, not just to isolated fixes. When a mapped friction point touches pricing clarity, onboarding tone, or how a sales team frames value, it’s a brand positioning issue as much as an experience issue, and it should be prioritized alongside go-to-market decisions, not separately from them.
Practical operating advice that holds up across engagements:
- Convert the opportunity list into a backlog item with an owner, not a slide that gets archived.
- Review the backlog in the same cadence as quarterly planning, so experience fixes compete for resources like any other initiative.
- Tie at least one opportunity per quarter to a measurable brand or growth metric, not just an operational one.
This is the kind of alignment work explored further in how customer experience breaks down between corporate functions, where ownership gaps, not lack of data, are usually the real blocker.
What facilitating these workshops actually teaches you
Every workshop that works has the same sponsor commitments up front: a real time block, the right participants in the room, and clear decision rights so the group isn’t just advisory.
Three things unblock the work every time: leadership names an owner before the workshop starts, leadership protects the follow-up meeting on the calendar, and leadership accepts a rough map over a delayed polished one. A quick sign-off checklist helps: objective defined, evidence collected, owners assigned, next review scheduled. If any box is empty, the map isn’t done yet.
— Quincy
How Quincy Samycia helps turn a map into owned outcomes
Running a workshop is one thing. Turning its output into a prioritized backlog that survives contact with next quarter’s planning cycle is the harder part, and it’s where most mapping efforts stall. A brand strategist works with founders, executive teams and marketing leaders to connect mapped experience gaps directly to brand positioning and measurable growth, using tailored frameworks to keep the work tied to outcomes rather than slides.
A typical engagement includes:
- A facilitated mapping or positioning workshop scoped to one persona and one scenario.
- A prioritized list of opportunities, each with a named owner and a success metric.
- An implementation roadmap that fits into existing quarterly planning.
For teams that want outside facilitation to keep a workshop focused and story-driven, Storyline Pros’ case studies show how narrative-led sessions can sharpen the back story before the sticky notes come out. Quincy also offers these formats as part of his speaking and workshop engagements. To see the full range of services, including Customer Experience, Brand Positioning and Growth and Go-to-Market Strategy work, visit Quincy Samycia’s site and get in touch about scoping a mapping engagement.
Where to go deeper on frameworks and templates
- Rutgers Business Review’s seven-step framework for governance-first journey mapping.
- Atlassian’s Team Playbook for a ready-to-run workshop agenda.
- Nielsen Norman Group’s guidance on building the narrative before the graphic.
- Miro’s template library for swim-lane and timeline formats.
- Quincy Samycia’s brand frameworks for linking maps to positioning and growth.
Sources
- What is a Customer Journey Map? | IBM
- Paths to purchase: The seven steps of customer purchase journey mapping | Rutgers Business Review
- How to create customer journey maps | MindTools
- Customer journey maps: When and how to create them | Nielsen Norman Group
- Customer journey mapping play | Atlassian Team Playbook
FAQ
What are the seven steps to map the customer journey?
Definitions vary across practitioners, but one widely cited version comes from the Rutgers Business Review, which outlines creating governance, mapping touchpoints, defining effective journeys, reaching target markets, measuring touchpoint strengths and weaknesses, quantifying costs and benefits, and avoiding common implementation pitfalls. The steps are meant to run sequentially rather than as a single workshop exercise.
What are the stages of customer journey mapping?
Common stages include awareness, consideration, purchase, postpurchase and advocacy, as IBM outlines. For complex B2B sales, it’s often clearer to split research, evaluation, procurement, implementation and renewal into separate stages instead of forcing a simple five-stage model.
How do I make a customer experience map from scratch?
Start by setting an objective and picking one persona and one scenario, then gather evidence from interviews, analytics and support logs before running a timeboxed workshop, as MindTools recommends. Synthesize the sticky notes into a minimum viable map, then prioritize opportunities by impact and effort and assign a named owner to each.
What tools work best for mapping customer journeys?
Collaborative whiteboards like Miro work well for live workshop sessions, while dedicated journey-mapping tools suit teams that need version control and export into product or issue-tracking systems. Miro’s customer journey map templates cover several common formats, including swim-lane and timeline layouts, so the right choice depends on your governance and handoff needs.
How often should a customer experience map be updated?
There’s no universal rule, but a practical cadence is quarterly for active, high-priority scenarios and annually for stable ones. The deciding factor should be whether the underlying evidence, interviews, analytics or support data, has shifted enough to change the sentiment line or the opportunity list.