
North Star Metric Examples and How to Pick Yours

A North Star metric is the one number that best captures the value your product delivers to customers. Strong examples include nights booked for a marketplace, messages sent for a communication tool, weekly active teams for a collaboration product, and items received on time for a delivery service. The right one for you depends on what customers are really buying from you, and this guide shows how to find it.
Below you will find examples by business type, the parts of the North Star framework, a step-by-step way to choose, the mistakes that waste the most time, and how we use the metric to align product, marketing and sales.
TL;DR
- A North Star metric is a single rate, count or ratio that measures the customer value your product delivers and reflects your strategy.
- Good examples measure value delivered: nights booked, rides taken, items received on time, time spent listening. Revenue alone rarely qualifies.
- The framework pairs the metric with roughly three to five input metrics that teams can influence week to week.
- Test any candidate with one question: could it double while customers get nothing extra? If yes, pick another.
- The metric earns its keep when product, marketing and sales all steer by it.
Table of Contents
- What a North Star metric is (and what the framework adds)
- North Star metric examples by business type
- The six families of North Star metrics
- How to choose your North Star metric
- Input metrics and guardrails
- Mistakes that waste the most time
- Aligning product, marketing and sales around one number
- Our perspective: the metric is a strategy decision, not an analytics task
- Work with us on your metric and positioning
- FAQ
- Sources
What a North Star metric is (and what the framework adds)
Amplitude, which popularized the approach, defines a North Star Metric as one critical rate, count or ratio that best captures the value a product delivers to users and represents the product strategy. Spotify’s experimentation team describes it in nearly the same terms: the single metric that best captures the value a product delivers to users.
The metric alone is only half the idea. The North Star Framework wraps it in four parts:
- The metric itself, stated in plain language.
- The customer value and business results it represents, so the number is never abstract.
- A small set of inputs, typically three to five, that teams can directly influence and that collectively produce the metric.
- The work each team does to move those inputs.
That structure is what turns a dashboard number into a strategy. As Amplitude’s own writing puts it, the framework links the North Star to three to five supporting input metrics that connect product vision, customer value and business goals.
North Star metric examples by business type
The examples that follow are the ones most often cited. Notice the pattern: each counts a moment where a customer got what they came for.
| Business type | Example metric | Customer value it captures |
|---|---|---|
| Marketplace (lodging) | Nights booked | A guest found a place to stay and a host earned income |
| Marketplace (general) | Completed transactions | Supply and demand met |
| Music streaming | Time spent listening | People are enjoying the product |
| Collaboration tool | Active projects per team, or weekly active teams | Teams rely on the product to get work done |
| Messaging | Messages sent | People are actually communicating |
| Grocery delivery | Items received on time per month | The order arrived complete and on schedule |
| Subscription video (early DVD model) | Share of customers placing three or more DVDs in their first session | A new customer has a full queue and a reason to stay |
Sources for the table: Metabase’s glossary lists nights booked, messages sent and weekly active teams. Spotify’s glossary lists time spent listening, completed transactions and active projects per team. Amplitude’s playbook covers Instacart and Netflix.
Marketplaces: count the match
In a two-sided marketplace, a metric that only counts buyers or only counts sellers leaves half the business invisible. Nights booked works because one number only moves when a guest and a host both get what they want. The same logic applies to rides taken or completed transactions.
Delivery and logistics: count the promise kept
Instacart’s example is useful because it is not revenue and not sign-ups. Amplitude’s playbook describes it as total monthly items received on time, and the inputs beneath it are breadth of selection, order volume, fulfillment and on-time delivery. Each input belongs to a different team, yet all of them pull the same number.
Subscription and media: count the habit
Netflix’s DVD-era metric was the percentage of customers placing three or more DVDs in their first session. According to the same playbook, Netflix said it captured its differentiation strategy and could improve customer value and retention. It is a leading indicator: you see it in the first session, long before a cancellation or a renewal.
SaaS and B2B: count the team, not the seat
For software sold to companies, the best candidates usually measure depth of use inside an account: weekly active teams, active projects per team, or workflows completed. Paid seats tell you what customers bought. Active teams tell you whether they will renew. If you sell to businesses, aligning teams around a shared operating metric is also what lets leadership settle priority arguments between product, marketing and operations without opinion wars.
Services and non-software businesses
Not every business has a product with daily users. A services firm, a retailer or a manufacturer can still pick a metric that counts delivered value: projects completed that met the agreed outcome, repeat purchases within 90 days, or orders delivered without a service ticket. These are illustrative patterns rather than company-reported figures, and the test for each is the same as for a tech giant’s metric: does it count a customer getting what they paid for?
The six families of North Star metrics
One useful way to narrow the field is to ask which type of growth your strategy bets on. Future’s guide sorts North Star metrics into six groups: revenue, customer growth, consumption growth, engagement growth, growth efficiency and user experience. Marketplaces such as Airbnb and Uber sit in consumption growth, measuring transaction volume through nights booked and rides taken.
A quick read of the families:
- Revenue: easy to measure, but backward-looking.
- Customer growth: counts new customers or accounts. Useful early, easy to inflate.
- Consumption growth: counts usage or transactions. Strong for marketplaces and utilities.
- Engagement growth: counts depth or frequency of use. Strong for subscriptions and collaboration tools.
- Growth efficiency: measures cost or speed of acquiring growth. Strong when scaling is the constraint.
- User experience: measures quality of the experience, such as on-time delivery or satisfaction.
Your choice of family should come from your strategy, not from copying a famous company in a different business.
How to choose your North Star metric
The criteria are consistent across the sources. Amplitude’s playbook says to choose a metric that expresses customer value, reflects product vision and strategy, predicts future success, is actionable, understandable and measurable, and is not a vanity metric. Here is a practical sequence.
- Write down the customer problem. Not your feature list. What job is the customer hiring you to do?
- Find the moment of value. The point where that job gets done: a stay completed, an order delivered, a project finished.
- List three to five candidate metrics that count that moment, or the behavior that predicts it.
- Run the doubling test. The Unified Product Graph framework puts the discipline in selection: if a metric could double without any improvement in user outcomes, it is a poor North Star.
- Check the leading-versus-lagging balance. Amplitude calls monthly revenue and average revenue per user generally suboptimal because they report past results rather than predict sustainable growth.
- Map the inputs. If you cannot name three to five levers that teams control, the metric is not actionable yet.
- Pressure-test with the room. Product, marketing, sales and finance should each be able to say how their work moves the number.
Allow time. Amplitude’s own guidance notes that a North Star can be one level out of reach, a composite of the parts of the company working in tandem. That is why choosing one rarely happens in a single meeting.
A worked example
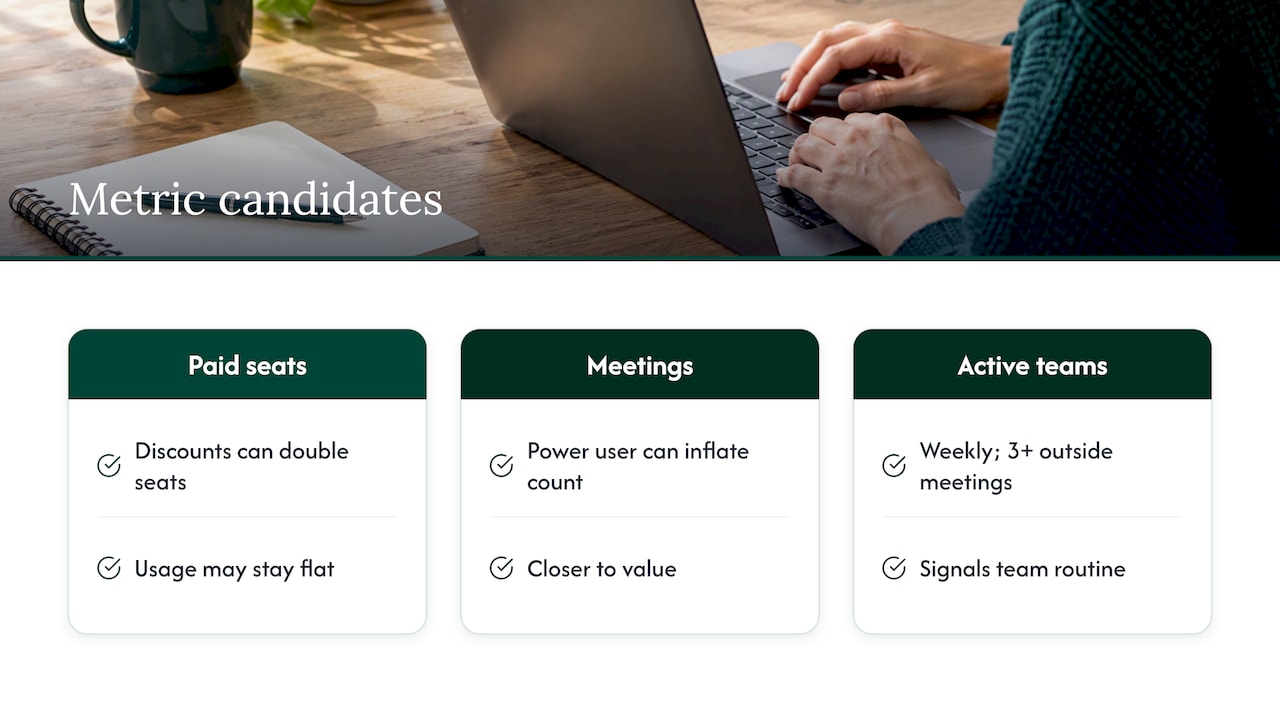
Imagine a B2B scheduling app (a hypothetical, for illustration only). Its leadership debates three candidates: paid seats, meetings scheduled, and weekly active teams that schedule at least three meetings with outside guests.
Paid seats fail the doubling test, since sales could double seats with discounts while usage stays flat. Meetings scheduled is closer, but one power user can inflate it. Weekly active teams scheduling externally counts the behavior that signals the product is part of the team’s routine. Inputs might then be: invitations sent to outside guests, calendar integrations connected, reminders delivered and time to first scheduled meeting. Each has a clear owner.
Input metrics and guardrails
Inputs are the levers. Amplitude describes them as factors teams can directly influence through day-to-day work that collectively produce the North Star. In the Instacart case, that means breadth, order volume, fulfillment and on-time delivery, not one team’s vanity number.
Guardrails are the other half. The North Star is a guiding light, and Shopify’s team notes it must be complemented by other operational KPIs that track the health of specific areas. In practice, a guardrail stops you from hitting the metric by damaging something else. If your North Star is orders delivered, a guardrail might be refund rate or support contacts per order.
Mistakes that waste the most time
- Choosing revenue because it is easy. It is a lagging outcome. It tells you what happened, not what is coming.
- Picking a vanity metric. Page views, downloads and registered users can climb while customers get nothing.
- Selecting a number nobody can influence. If no team owns a lever, the metric becomes a poster.
- Writing a vague definition. “Engagement” is not a metric. “Weekly active teams with three or more completed projects” is.
- Never revisiting it. PostHog notes that early-stage startups may need different metrics than established, mature companies, so reassess as the business evolves.
- Treating it as the only number. It is the lead instrument, not the whole panel.
Aligning product, marketing and sales around one number
This is where the metric pays back. Amplitude says the combination of metric and inputs supports informed decentralized decisions, alignment and communication across the company. Spotify’s team adds that a well-defined North Star gives people a common reference point for cross-functional disagreements about priorities.
Here is what that looks like in each function:
- Product prioritizes work that moves an input, and says no to work that does not.
- Marketing targets and messages toward the customers most likely to reach the moment of value, not just to sign up.
- Sales qualifies for fit with that moment, which shortens cycles and reduces churn.
Without a shared number, each team optimizes its own metric: leads, demos, features shipped. That is how a company ends up with strong activity and weak growth. If you want to go deeper on the handoffs between teams, see our piece on sales and marketing alignment. For the brand side of measurement, our guides to brand performance metrics and brand health metrics show which signals sit upstream of revenue.
Founders moving fast can also see how we link a metric to a cadence in 12-week growth sprints, and why strategies tied to a single growth measure tend to hold up as a company scales.
Our perspective: the metric is a strategy decision, not an analytics task
We see the same pattern with founders and executive teams. They arrive with a dashboard full of numbers and no agreement on which one matters. The debate looks like a data problem. It is almost always a positioning problem.
If you cannot say who you serve, what you do better than the alternatives and what a customer gets, you cannot pick a metric that counts it. Product wants to measure features. Marketing wants to measure leads. Sales wants to measure bookings. All three are right inside their own frame, and none of them is wrong. The brand, the product and the sales motion simply are not pointing at one customer outcome.

Our approach comes from building brands as an operator, across more than 200 international retail locations, and from exit experience. That shapes one conviction: brand is a core business strategy, and it has to connect to measurable performance. So we work backward. Clarify the position, define the moment of value that proves the position is real, then choose the metric and inputs that count it. Done in that order, the North Star stops being a number that product owns and becomes a shared language across product, marketing and sales.
One practical test we use: ask each leader to explain, in a sentence, how their team moved the North Star last quarter. If the answers are vague, the metric is not yet doing its job, however good it looks on a slide.
— Quincy
Work with us on your metric and positioning
If your teams are pulling in different directions, the fastest fix is usually a positioning and alignment engagement that ends with an agreed North Star and input metrics each team owns. We offer brand strategy, positioning and growth advisory for founders, executive teams and marketing leaders, plus workshops built around our brand strategy frameworks.
Bring your current metrics and the disagreements around them. We will help you turn them into one shared definition of customer value and a plan teams can run.
FAQ
What is a good North Star metric example for a startup?
A good startup example counts the moment a customer gets value, such as nights booked, messages sent or weekly active teams. Early on, pick a metric you can influence in weeks, not quarters. Expect to revisit it as the business matures.
Is revenue a good North Star metric?
Usually not. Amplitude calls monthly revenue and average revenue per user generally suboptimal because they report past results instead of predicting growth. Revenue is better treated as the business result your North Star should lead to.
How many metrics should support a North Star?
The framework typically uses three to five input metrics. That is enough to cover the main levers teams control without scattering attention. Add guardrail metrics separately to protect quality and customer experience.
How often should we change our North Star metric?
Reassess it periodically, and certainly when your strategy, customer or business model shifts. Early-stage companies often outgrow their first metric. Avoid changing it so often that teams stop trusting it.
Sources
- Amplitude, The North Star Playbook
- What is a North Star Metric? Confidence by Spotify
- What is a north star metric? Metabase Glossary
- What Makes a Good vs Bad North Star Metric, Amplitude
- Every Product Needs a North Star Metric, Amplitude
- North Star Metric: How To Choose a NSM for Your Company, Shopify
- Finding your North Star metric and why it matters, PostHog
- Choosing Your North Star Metric, Future
- North Star Metric, UPG Reference